
Cheatsheet functions & numbers
| Function | Input example | Effect | Output example |
| r() simple random function | ###r(1,10,0.1,2dp)### |
Generates a random number from 1 (included) to 10 (not included)*
*Any other numbers can be used, but the upper limit will never be included into the range
This logic is applicable to all of the randomization |
1.00, 1.10, 8.30, 9.90 |
| rf() complex random function | ###rf(1,10,1,(x**2)+6)### | Generates a random number from 1 (included) to 10 (not included), but also creates a sequence from which the random number will be chosen | …31, 55 … |
| Display accuracy format |
|||
| Function | Input example | Effect | Output example |
| dp number of decimal places | ###r(1,15,0.1,2dp)### | Defines how many decimal places are allowed in the answer | 8.30, 5.90, 1.20, 9.60, 3.70 |
| sf number of significant figures | ###rf(1,10,1,x**2)### | Defines how many significant figures are allowed in the answer | 4, 49, 81, 16 |
| ^ forced round up | ###r(10.1,10.9,0.1,0dp^)### | Forces rounding up against the rule of "point five" | 11 |
| $ forced round down | ###r(10,10.9,0.1,0dp$)### |
Forces rounding down against the rule of "point five" | 10 |
| Random words generation | |||
| Function | Input example | Effect | Output example |
| ###animal### | Generates a random animal (plural will always take s) | Lion, tiger, bear | |
| ###bigdistance### | Generates a random unit: km or miles | km | |
| ###city### | Generates a random UK city | London | |
| ###color### | Generates a random colour | Purple | |
| ###day### | Generates a random day of the week | Sunday | |
| ###fooditem### | Generates a random food item (plural will always take s) | Noodles | |
| ###lastname### | Generates a random last name | Smith | |
| ###name### | Generates a random name | Mohammad | |
| ###nameboy### | Generates a random boy’s name | Sebastian | |
| ###namegirl### | Generates a random girl’s name | Ella | |
| ###schoolsubject### | Generate a random school subject | Art | |
| ###sport### | Generates a random sport | Soccer | |
| Making a calculation | |||
| Function | Input example | Effect | Output example |
| + (addition) | ###a:(5+3)### | a is assigned as a result of 5+3 | a = 8 |
| - (subtraction) | ###=(5-3)### | The result is 5-3 | 2 |
| * (multiplication) | ###b:(5*3)### | b is assigned as a result 5*3 | b = 15 |
| / (division) | ###a:(5/3)### | a is assigned as a result of 5/3 | a = 1.666666666666667 |
| ** (power) | |||
| Displaying a calculation |
|||
| Function |
Input example | Effect | Output example |
| dp number of decimal places | ###=3dp(5/3)### | 3 decimal places are allowed in the display of the calculation | 1.667 |
| sf number of significant figures |
###=3sf(5/3)### |
3 significant figures are allowed in the display of the calculation | 1.67 |
| $ forced round down | ###=3sf$(5/3)### | Roundown is forced in the display of the calculation | 1.66 |
| =(/) fractions permit | ###=(5/3)### | Fractions are allowed in the display of the calculation | 5/3 |
| Variable declaration |
|||
| Function | Input example | Effect | Output example |
| variable:value single declaration | ###a:r(1,10,1,2dp)### | Store random value in variable a and reuse it several times by calling ###a### | 8 |
| variables:values multiple declaration | ###a,b,c:r(1,10,1,2dp)### | Stores random values in multiple variables a, b, c at once | 3, 3, 6 |
| variables!!:values multiple declaration ensuring uniqueness | ###a,b,c!!:r(1,10,1,2dp)### | Stores random values in multiple variables a, b, c at once, but only uses unique (not-repeatable inside of one output) values for the variables | 3, 9, 4 |
| Mathematical functions |
|||
| Function | Input example | Effect | Output example |
| median() | ###median(a,b,c)### | Calculates median of a, b, c where a is 4, b is 7, and c is 21 | 7 |
| ###=1dp(median(a,b))### | Calculates median of a, b, c where a is 4, b is 7, and c is 21, and only 1 decimal place is allowed | 5.5 | |
| mode() | ###mode(a,b,c)### | Calculcates mode of a, b, c where a is 4, b is 4, c is 21 | 4 |
| mod | ###a### mod ###b### = ###=(a mod b)### | Allows to calculate the modulus by extracting it from the variables. | flexible |
| mean() | ###mean(a,b,c)### | Calculates mean of a, b, c where a is 4, b is 4, and c is 21 | 29/3 |
| ###=3dp(mean(a,b,c))### | Calculates mean of a, b, c where a is 4, b is 4, and c is 21, and 3 decimal places are allowed | 9.667 | |
| =R() |
###=R(a)### ###=R(a+b*2)### |
Displays any number or calculation as Roman Numeral(s) | XVIII |
| quot | ###a### quot ###b### = ###=(a quot b)### | Calculates the quotient of the variables. | flexible |
Picking and sorting variables |
|||
| Function | Input example | Effect | Output example |
| max() | ###max(a,b,c)### | Takes the maximum of the list of variables. Imagine that a is 4, b is 4, c is 21 | 21 |
| min() | ###min(a,b,c)### | Takes the minimum of the list of variables. Imagine that a is 4, b is 4, c is 21 | 4 |
| randwrong() | ###randwrong(a,b,c)### | Chooses randomly a wrong answer from a list of variables basing on variables with random assigned values in the answer box. If a is 4, b is 4, and c is 21, and the correct answer is 4 | 21 |
| randwrong!() | ###randwrong!(a,b,c)### | Chooses randomly a wrong answer from a list, but if you use it repeatedly, it makes sure that each subsequent use is a unique randomly chosen wrong variable. If a is 4, b is 6, and c is 21, and the correct answer is 4 | 21 |
| ###randwrong!(a,b,c)### | If a is 4, b is 6, and c is 21, and the correct answer is 4 - second usage in the same question | 6 | |
| ###randwrong!(a,b,c)### | If a is 4, b is 6, and c is 21, and the correct answer is 4 - third usage in the same question | ERROR - no more wrong variations | |
| randwrong!!() | Chooses randomly a wrong answer from a list and makes sure that each subsequent use is a unique randomly chosen wrong variable like randwrong!(). Randwrong!! differs because it is much stricter and it never repeats the values in the output even if the values are repeated in the arguments list | ||
| randvar() | ###randvar(a,b,c)### | Chooses randomly a variable from a list. If a is 4, b is 6, and c is 21, and the correct answer is 4 | 21 |
| randvar!() | ###randvar!(a,b,c)### | Chooses randomly a variable from a list but if you use it repeatedly, it makes sure that each subsequent use is a unique randomly chosen variable. If a is 4, b is 6, and c is 21, and the correct answer is 4 | 21 |
| ###randvar!(a,b,c)### | If a is 4, b is 6, and c is 21, and the correct answer is 4 - used second time | 4 | |
| ###randvar!(a,b,c)### | If a is 4, b is 6, and c is 21, and the correct answer is 4 - used third time | 6 | |
| ###randvar!(a,b,c)### | If a is 4, b is 6, and c is 21, and the correct answer is 4 - used fourth time | Oy vey! | |
| sortup() | ###sortup1(a,b,c)### | Gives the n value from smallest to biggest. Sortup is equivalent to min. If a is 4, b is 5, c is 21, and the correct answer is 4 | 4 |
| ###sortup2(a,b,c)### | If a is 4, b is 5, c is 21, and the correct answer is 4 - second time | 5 | |
| ###sortup3(a,b,c)### | If a is 4, b is 5, c is 21, and the correct answer is 4 - third time | 21 | |
| sortdown() | ###sortdown1(a,b,c)### | Gives the n value from biggest to smallest. Sortdown is equivalent to max. If a is 3, b is 5, c is 18, and the correct answer is 4 | 18 |
| ###sortdown2(a,b,c)### | If a is 3, b is 5, c is 18, and the correct answer is 4 - second time | 5 | |
| ###sortdown3(a,b,c)### | If a is 3, b is 5, c is 18, and the correct answer is 4 - third time | 3 | |
| OTTER directives |
|||
| Function | Input example | Effect | Usage example |
| never() |
never(a=b) | a = b is never allowed for random values in variables; no matter how random they are, a = b is ensured *please use carefully and only with a wide range of vars (a and b values in no less than 100 variations) to avoid critical mistakes |
###a:r(1,10)### |
| must() | must(a>b) | a > b is priority for random values in variables; no matter how random they are, a > b is ensured *please use carefully and only with a wide range of vars (a and b values in no less than 100 variations) to avoid critical mistakes |
###a:r(1,10)### ###b:r(a,20)### ###must(b>a)### |
| Answer flags |
|||
| Function | Input example | Effect | Output example |
| +- | ###+-### | Allows both positive and negative answers | 15, -27 |
| allfrac | ###allfrac### | Allows fractions that are not in their simplest form | |
| nofrac | ###nofrac### | Disallows all fractions as answers | 0.47826086956 , 0.478261, 0.4782609, 0.47826087, 0.478260870, 0.4782608696 |
| yesfrac | ###yesfrac### | Allows fractions in answers | |
| onlyfrac | ###onlyfrac### | Doesn’t allow decimal format answers | |
Answer flags: decimal accuracy |
|||
| Function | Input example | Effect | Output example |
| dp | ###1dp### | Exactly accurate to one decimal place is accepted | 0.5 |
| ###+1dp### | Accurate to one or more decimal place is accepted | 0.5 … 0.47826086956 | |
| ###1:3dp### | Accurate to 1 to 3 decimal places is accepted | 0.5, 0.49, 0.478 | |
| sf | ###1sf### | Exactly accurate to one significant figure is accepted | |
Useful shortcuts |
|||
| Function | Input example | Effect | Output example |
| answer | ###ans:a### | Correct answer assigned to variable a | |
| ###ans### | Correct answer, stored in a variable a, retrieved in the answer template. If a is 15 | 15 | |
| result | ###result:mode(a,b,c)### | Result of the calculation is assigned to mode of a, b, c. If a is 5, b is 7, and c is 5 | 5 |
| ###result### | Result, stored in mode of a, b, c, retrieved in the answer template. If a is 5, b is 7, and c is 5 | 5 | |
| wrong | ###wrong:a### | Wrong answer assigned to variable a | |
| ###wrong### | Wrong answer, stored in a variable a, retrieved in the answer template. If a 0.97 | 0.97 | |
|
WARNING: ONLY USE WITH CHARTS TAG |
|||
| Function | Input example | Effect | Usage Example |
| chart.vbar | axis y legend ###chart.vbar(bar lengths 1 in order, bar length 2 in order, bar length 3 in order){label A, label B, label c}### axis x legend |
Creates a is a simple chart with several vertical bars. |
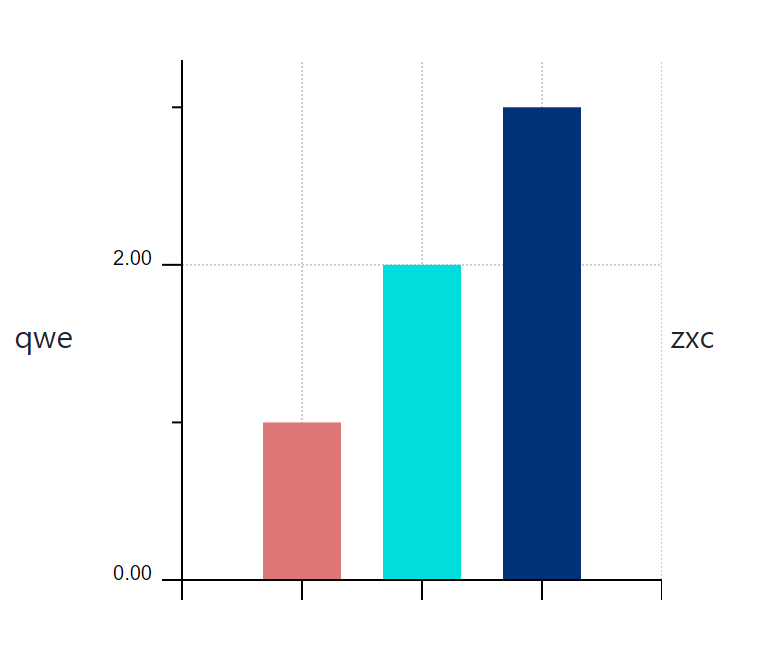 |
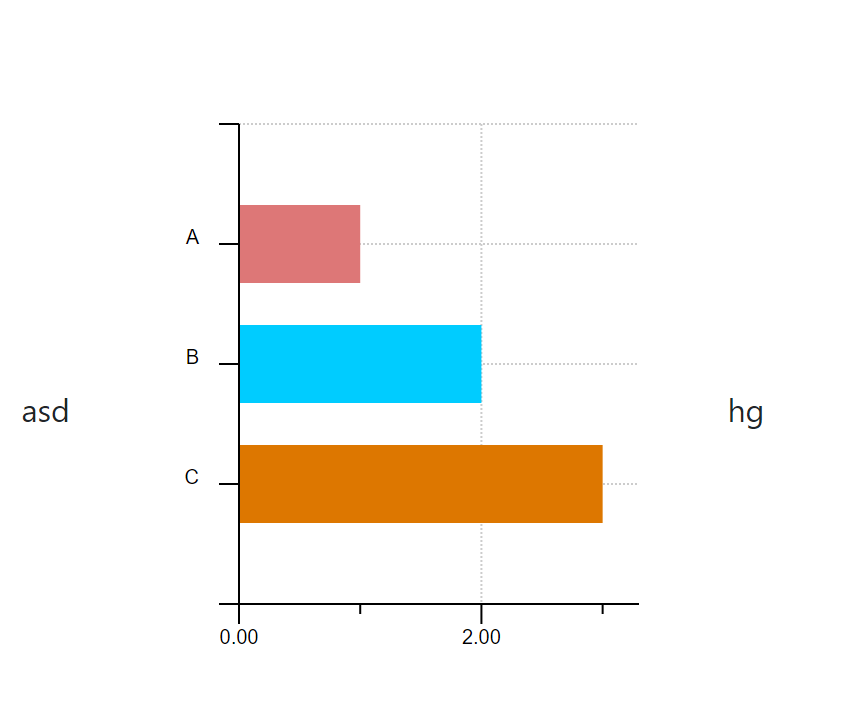
| chart.hbar | axis y legend ###chart.hbar(bar lengths 1 in order, bar length 2 in order, bar length 3 in order){label A, label B, label c}### axis x legend |
Creates a smiple chart with several horizontal bars. |
|
| chart.pie | ###chart.pie(pie sector 1 in order, pie sector 2 in order, pie sector 3 in order){label A, label B, label C}[Colour 1, Colour 2, Colour 3]### | Creates a round charts with sectors representing data. | ###chart.pie(10,20,25){Label1,Label2,Label3}[red,green,blue]###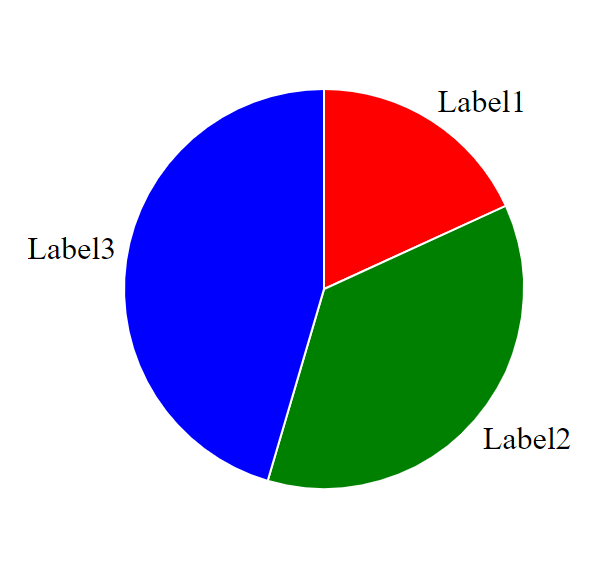 |
| chart.hbarstack | ###chart.hbarstack((bar1 lengths in order),(bar2 legths in order),…){labels in order}[(colour,legend),… in order]&title=”title”;&xaxis=”x-axis”;&yaxis=”yaxis”;&scalestart=5; &scalestep=4; &scaleend=200### |
Creates a stacked horizontal bar chart where the horizontal bars are divided into data sectors. | ###chart.hbarstack((a,b,c),(d,e,f),(g,h,i)){iOS,Android,Windows}[(blue, A),(purple, B),(pink, C)]&title="Multiple words title"###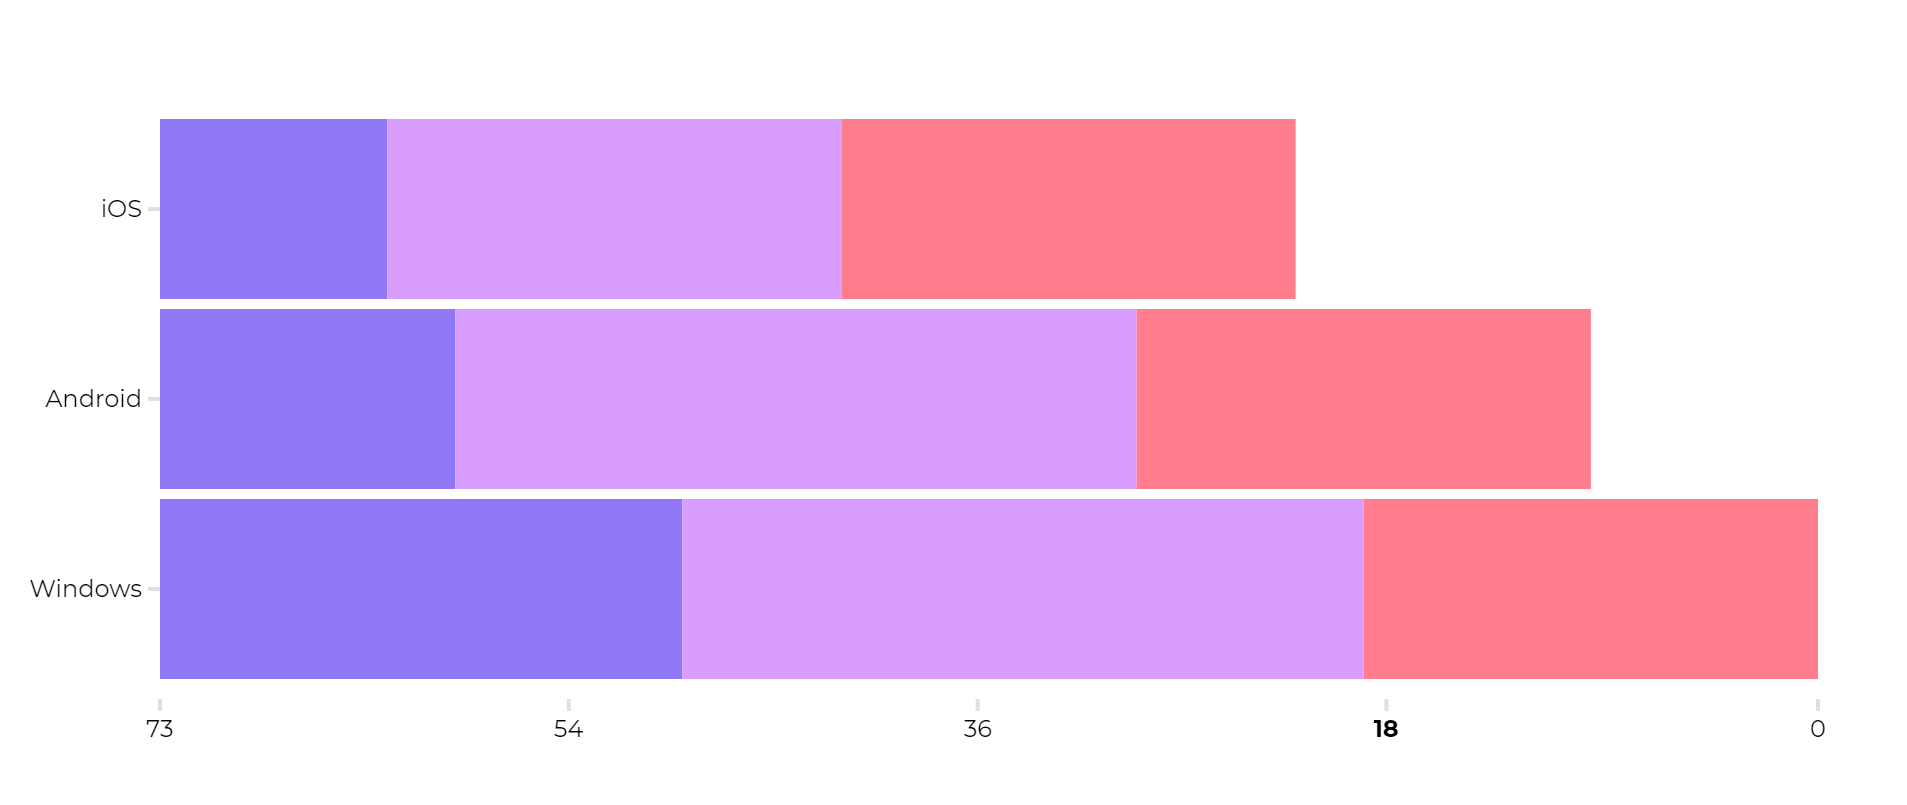 |
| chart.vbarstack | ###chart.vbarstack((bar1 lengths in order),(bar2 legths in order),…){labels in order}[(colour,legend),… in order]&title=”title”;&xaxis=”x-axis”;&yaxis=”yaxis”;&scalestart=5; &scalestep=4; &scaleend=200### |
Creates a stacked vertical bar chart where the vertical bars are divided into data sectors. | ###chart.vbarstack((a,b,c),(d,e,f),(g,h,i)){iOS,Android,Windows}[(blue, A),(purple, B),(pink, C)]###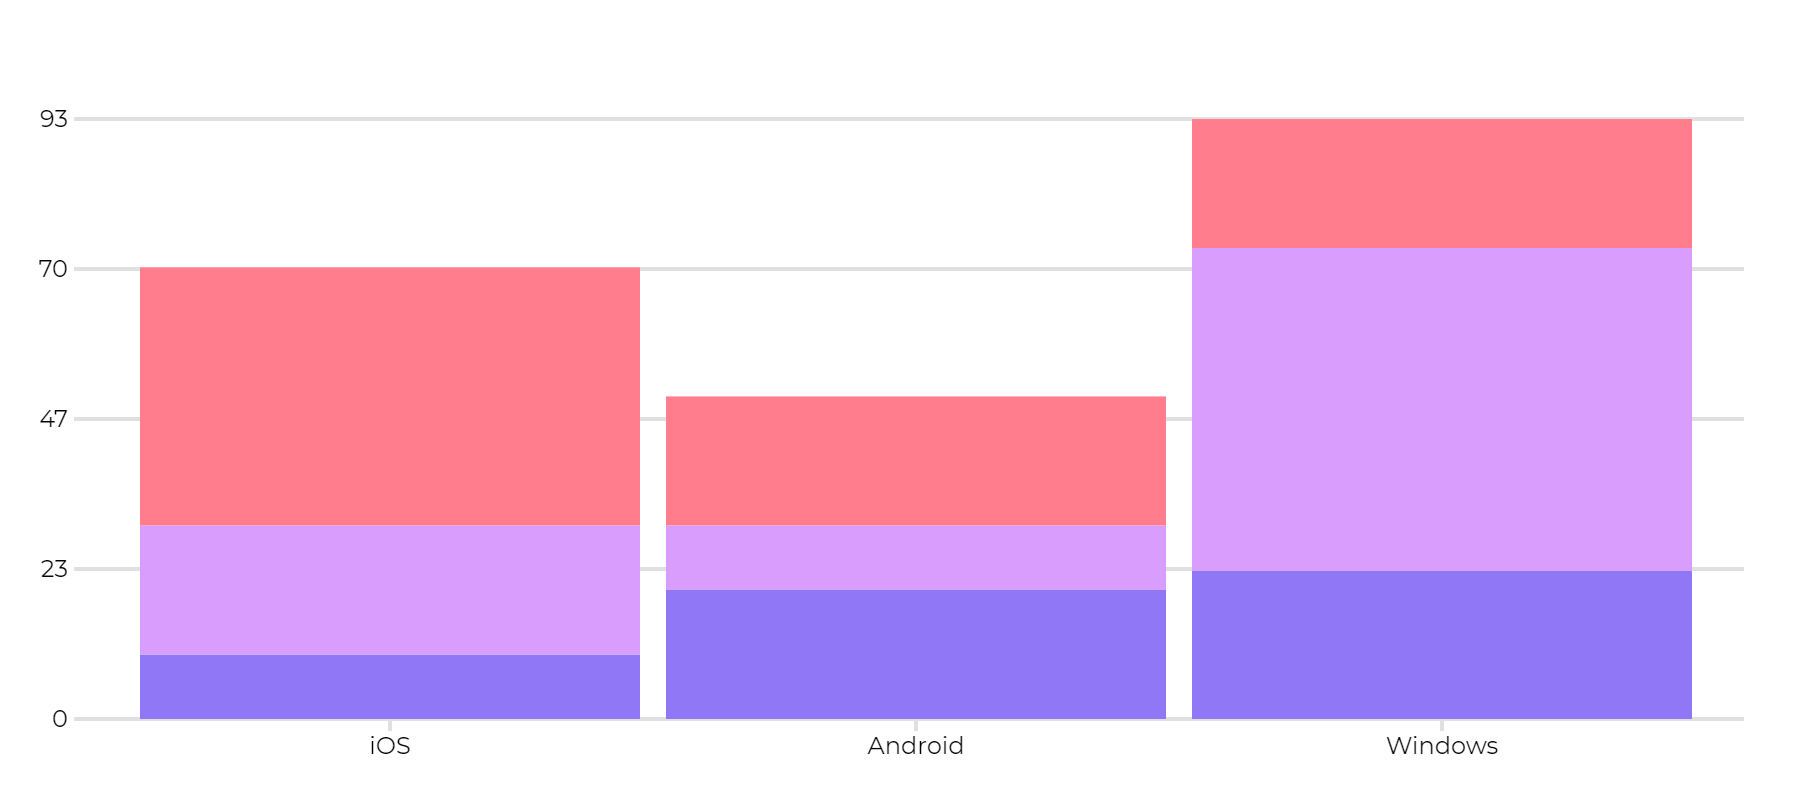 |
| chart.hbarcluster | ###chart.hbarcluster((cluster1 lengths in order),(cluster2 legths in order),…){labels in order}[(colour,legend),… in order]&title=”title”;&xaxis=”x-axis”;&yaxis=”yaxis”;&scalestart=5; &scalestep=4; &scaleend=200### |
Creates a clustered horizontal bar charts where the bars are put in groups of "data-clusters". | ###chart.hbarcluster((a,b,c,d),(e,f,g,h)){iOS,Android}[(blue, A),(purple, B),(orange, C),(pink,D)]###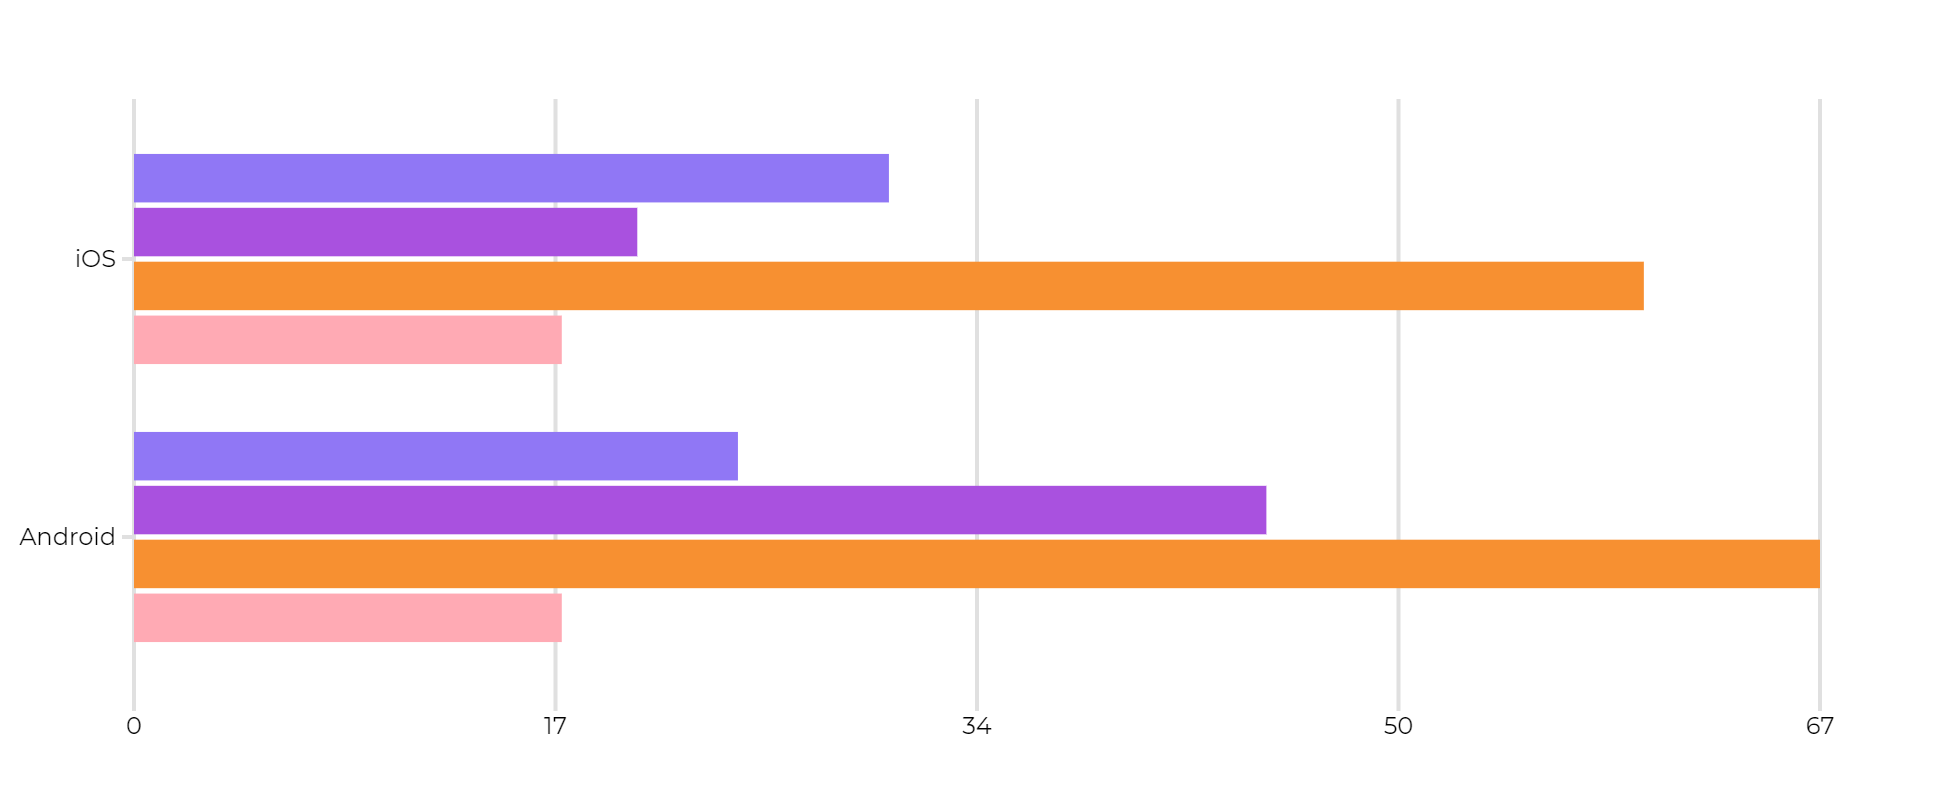 |
| chart.vbarcluster | ###chart.vbarcluster((cluster1 lengths in order),(cluster2 legths in order),…){labels in order}[(colour,legend),… in order]&title=”title”;&xaxis=”x-axis”;&yaxis=”yaxis”;&scalestart=5; &scalestep=4; &scaleend=200### |
Creates a clustered vertical bar charts where the bars are put in groups of "data-clusters". | ###chart.vbarcluster((a,b,c),(d,e,f),(g,h,i),(j,k,l)){iOS,Android,Windows}[(blue, A),(purple, B),(orange, C),(pink, D)]###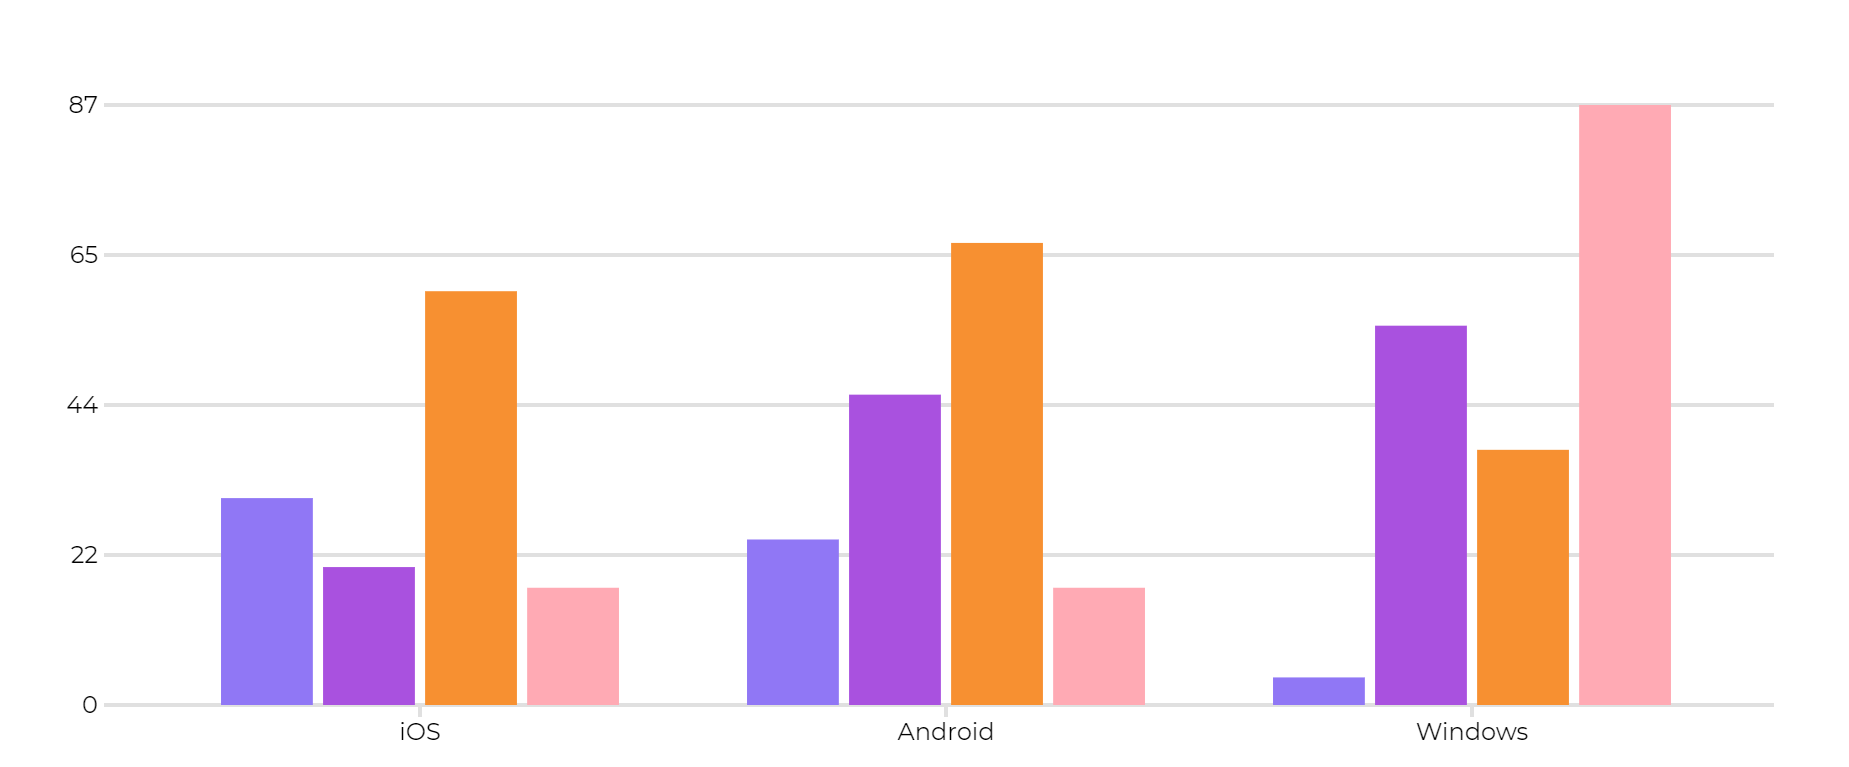 |
| chart.pyramid | ###chart.pyramid(bar lengths in order, from bottom top, in pairs (left, right)){bar labels in order, bottom Cto top}[left label, right label]&title=”title”;&scalestart=5; &scalestep=4;&scaleend=200### |
Creates a pyramide-like chart. |
###chart.pyramid((a,2),(4,5)){iOS,Android}[LFT,RT]&title=namegirl1### |
| chart.gantt | ###chart.gantt((start1, finish1),(start2, finish2),…){bar labels in order}&title=”title”;&scalestart=5; &scalestep=4;&scaleend=200### |
Creates a Gantt chart. | ###chart.gantt((a,b),(c,d),(e,f),(g,h),(i,j)){JAN,FEB,MAR,APR,MAY !!}&title="test title"###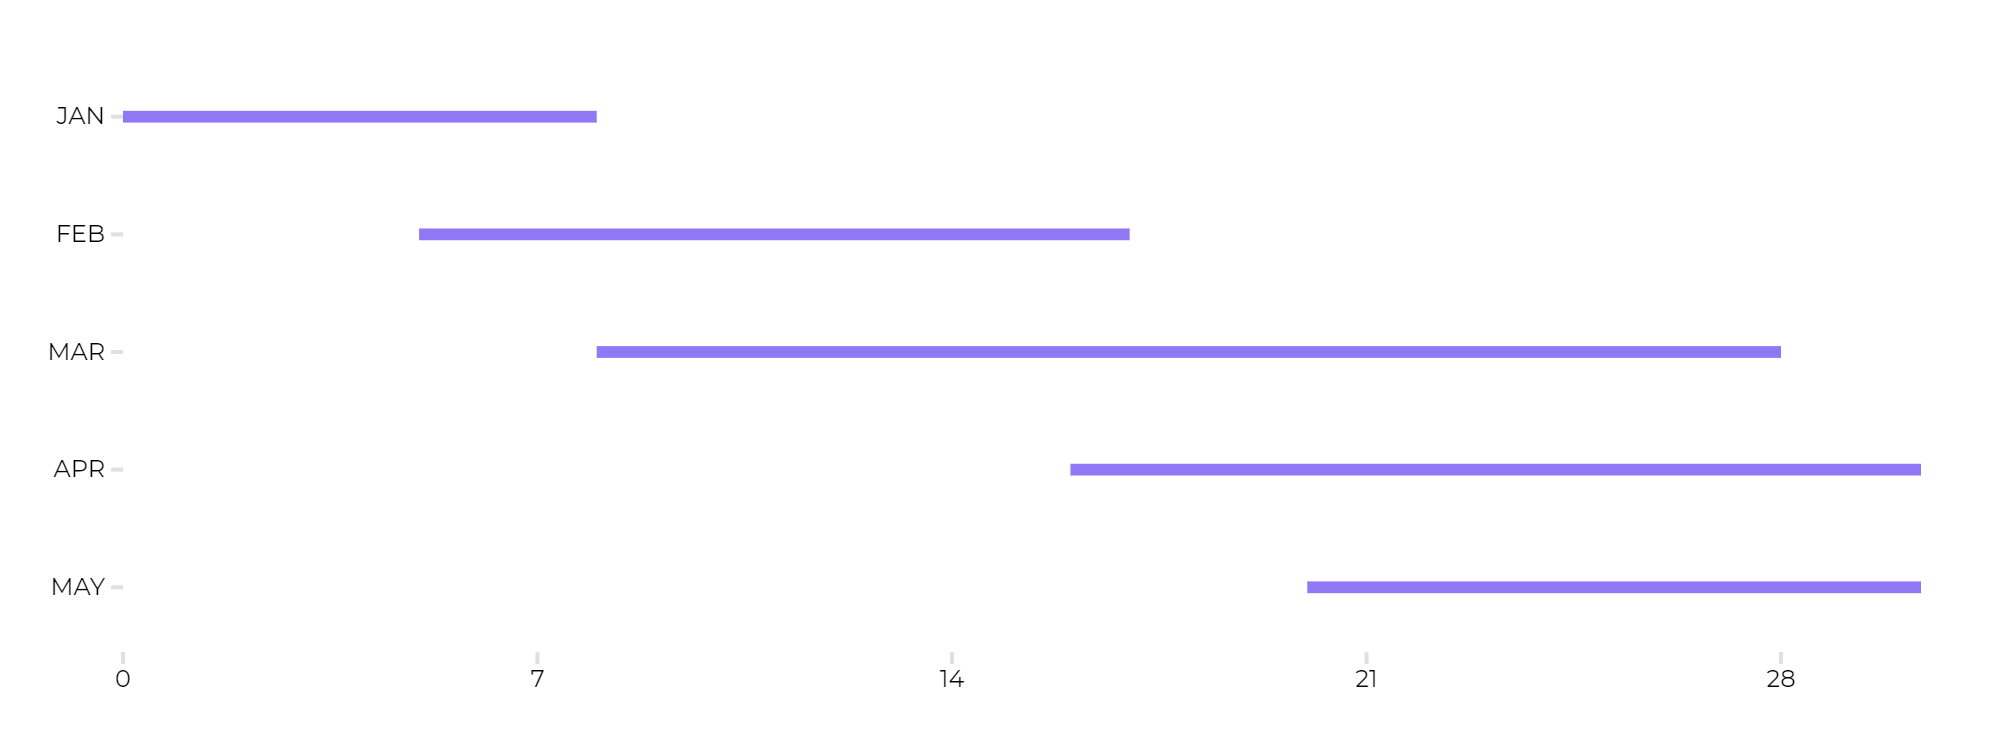 |
| chart.conpoint |
###chart.conpoint((x1,y1)s(x2,y2)c[somex,somey](x3,y3)){line-withpoints}&title=”title”;&xaxis=”something”;&xaxisstyle=arrow; |
Creates a line chart of a kind that typically shows the progress of some data of phenomenon, as it escalates and goes down.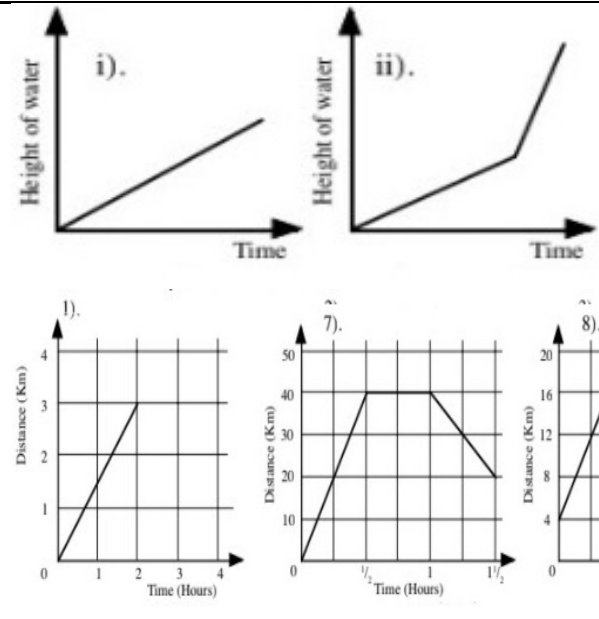 |
###chart.conpoint((a,2)s(4,5)s(1,10)c[2,20](5,20))&title=a### here s means STRAIGHT connection c[somex,somey] means CURVED with the coordinates represented the “attractor” to which the curve is pulled towards |
| chart.mconpoint |
same logic as chart.conpoint, but two lines are set instead of one |
Creates a line chart of the same type as chart,conpoint but it allows you to display two lines simultaneously.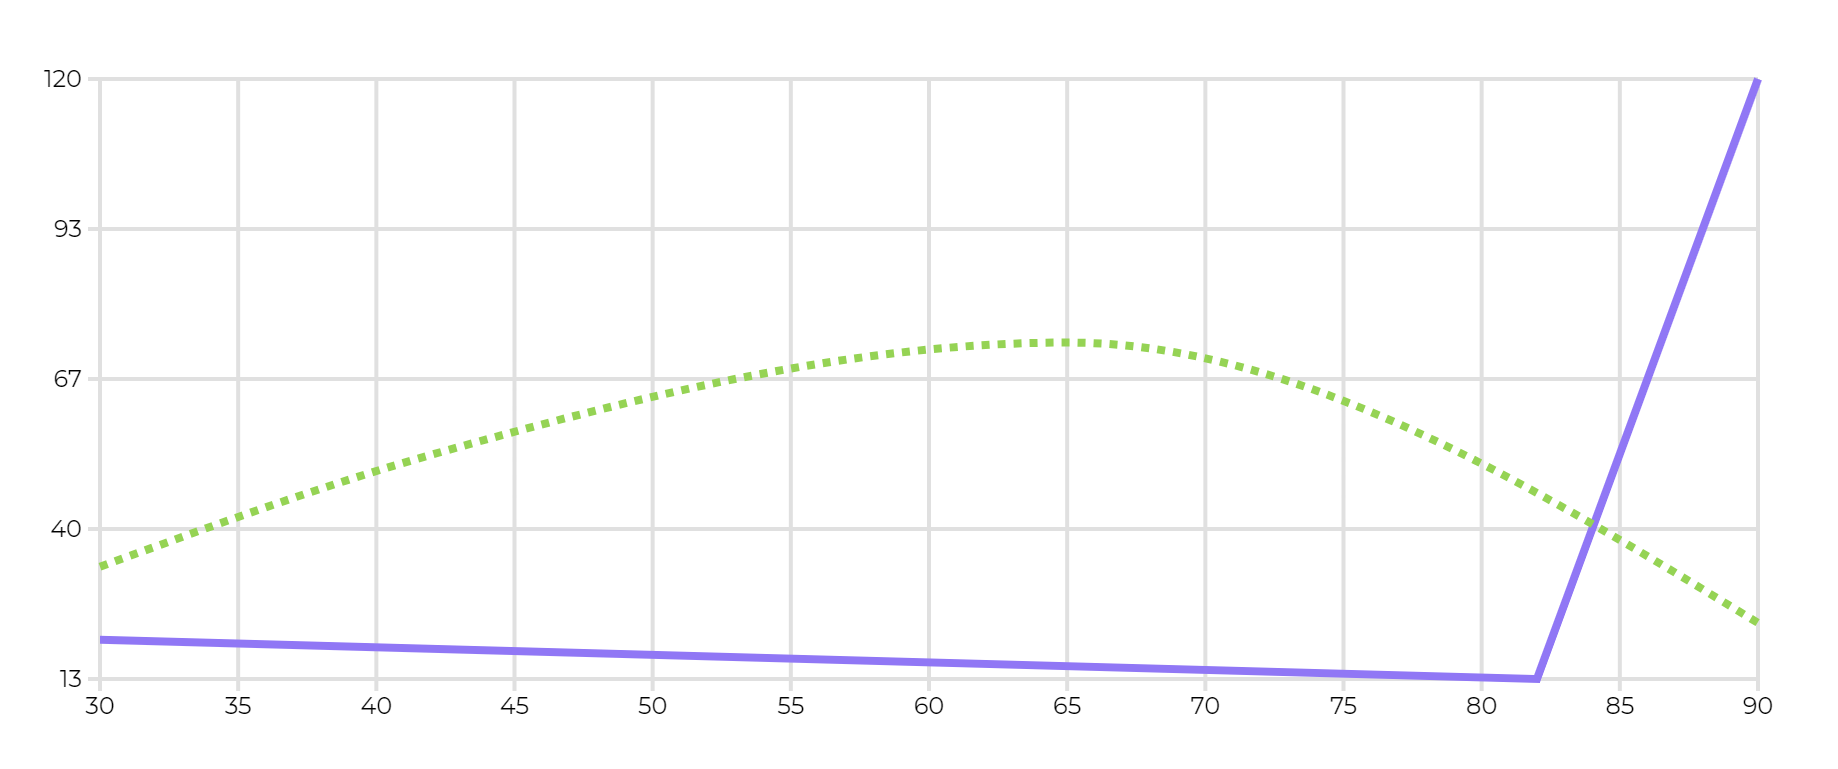 |
###chart.mconpoint[((a,b)s(c,d)s(e,f)c[g,h](i,j)){Label1, stroke, red},((k,l)s(m,n)s(o,p)c[q,r](s,t))]&title=a### |
No Comments